As described in the overview, "Explain" aims to provide insights into the factors driving, or contributing to, a data point of interest. Explain automatically determines the elements that contribute to a data point's value using two complementary processes - Dominant Drivers and Influencers - based on a machine learning technique called "partial decision tree segment analysis."
Note: This feature is available with an Enterprise license only.
The following provides an explanation of how it works and how better to understand the results.
Consider the following extract from a Telco dataset (click here to download the spreadsheet)
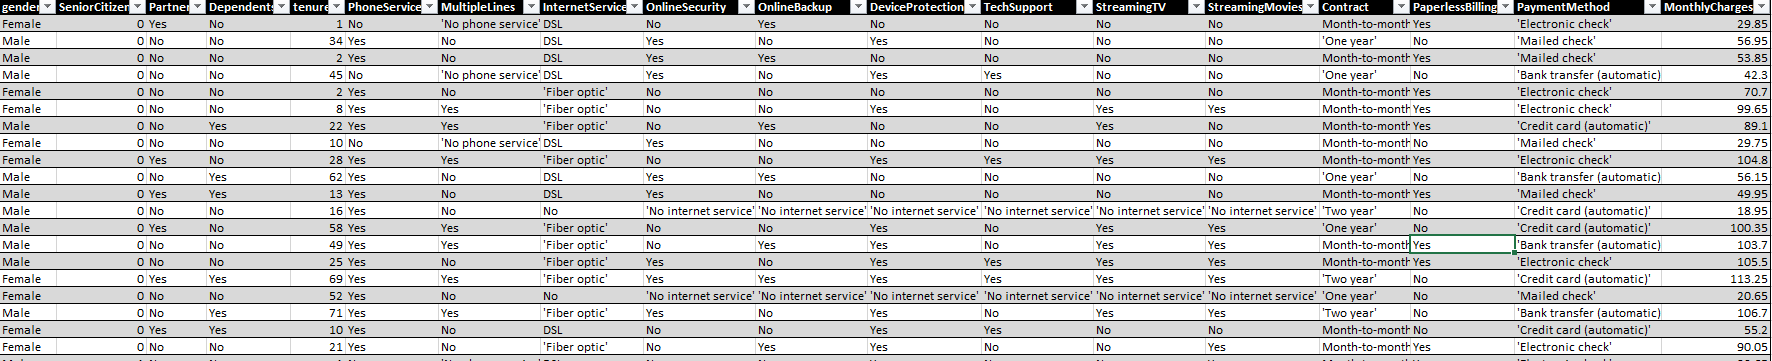
Each row is a customer along with characteristics of their subscription. Notice that there are numerous characteristics. In driving this analysis manually, a user would need to look through each and every one to find what is driving Monthly Charges.
Dominant Drivers
We might be interested in knowing what drives the additive value of Monthly Charges. In this small subset of the data, the sum of all monthly charges across all customers (60 in total) is 4212.55. Simply put, the "Dominant Drivers" analysis automatically determines which categorical dimensional elements account for most of this sum.
It does this in a hierarchical fashion, subject to some user-modifiable constraints to limit the amount information presented. Imagine constructing a simple table for each of the categorical columns in turn, and then selecting the single categorical value with the highest sum of Monthly Charges - this is effectively what the dominant drivers algorithm does.
For example, the following shows pivot tables for the first three categorical columns in the data.
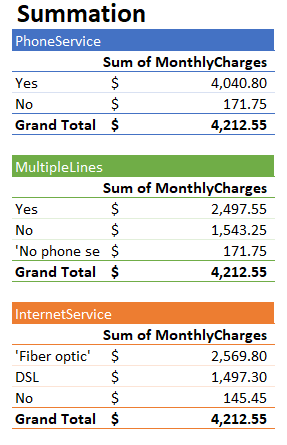
As it turns out, Phone Service=Yes has the highest sum of Monthly Charges out of all categorical elements. When viewed in Pyramid in the simple Explain interface, it is represented by the outer oval and the first node of the upper arc of the tree visualization in the more advanced visualization.
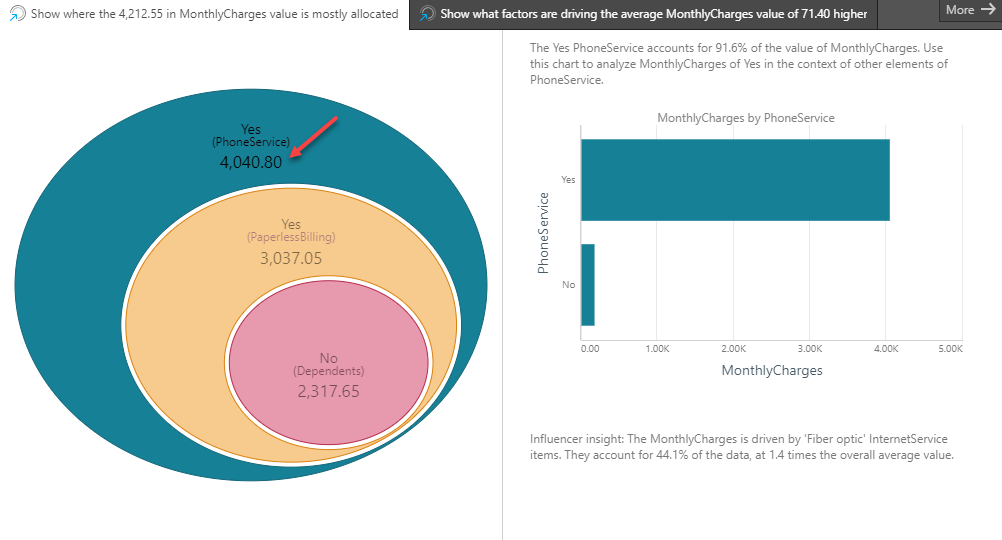
The algorithm then repeats this process, but only considering the data that corresponds to Phone Service=yes. The result is represented by the middle oval of the visualization and the second node of the upper arc in the tree visualization. In this case, Paperless Billing=Yes accounts for the largest proportion of the sum of Monthly Charges within the Phone Service=Yes segment.
Finally, the innermost oval of the visualization (and terminal node of the upper arc of the tree) is determined by the same process, but only considering the data that corresponds to the segment where Phone Service=Yes and Paperless Billing=Yes. Each subsequent oval, from outer to inner, represents a smaller subset of the data, and characterizes the segment of the customer base that accounts for most of the Monthly Charges.
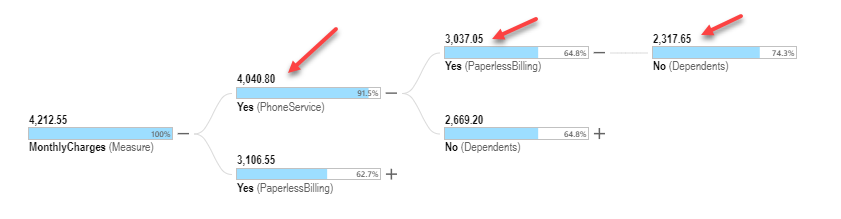
The tree visualization provides additional information by presenting the top n (user-configurable) categorical elements per node of the tree. In the tree visualization above, the root node (leftmost one) represents the full dataset; then the next level shows two paths: the upper starts with Phone Service = Yes (as just discussed), while the lower starts with the categorical element with the second largest sum of Monthly Charges. In this case, it is Paperless Billing = Yes. In this way, multiple arcs are defined - each representing a different segment of the customer base.
Obviously the full tree shows many other branches of the analysis as well, giving a deeper set of insights.
Influencers
The Influencers analysis works in the same way but, in this case, it focuses on the average of Monthly Charges instead of the sum. A large sum could be the result of a large amount of data rather than high values. Analyzing the average will highlight this fact. The algorithm's constraints, especially minimum allowable number of rows in a segment, are more important in this case in order to ensure that the computed average is reliable. Importantly, the Influencers analysis uses both categorical data and other metric data related to the data point.
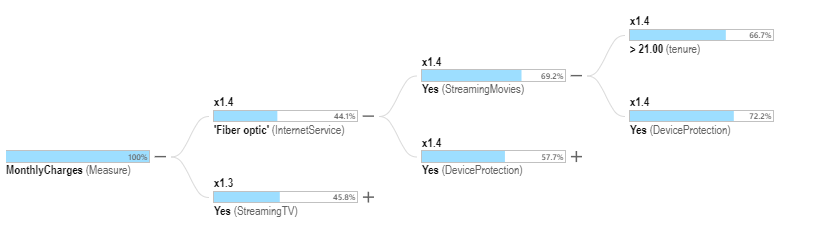
Using our example dataset, the average Monthly Charges over the whole customer base is 70.21. Below are the same tables we saw before, but this time the aggregation is the average of Monthly Charges instead of the sum.
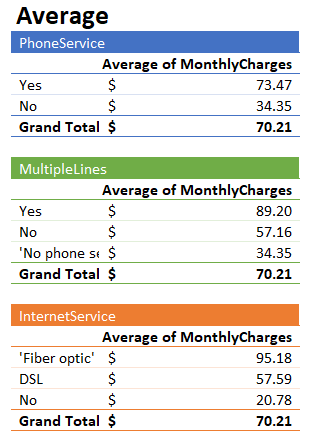
We can see that Internet Service=Fiber optic has the highest average Monthly Charges, whereas it had the second highest sum (compare to the tables above). Phone Service=Yes, which had the largest sum of Monthly Charges, is third now in terms of the average.
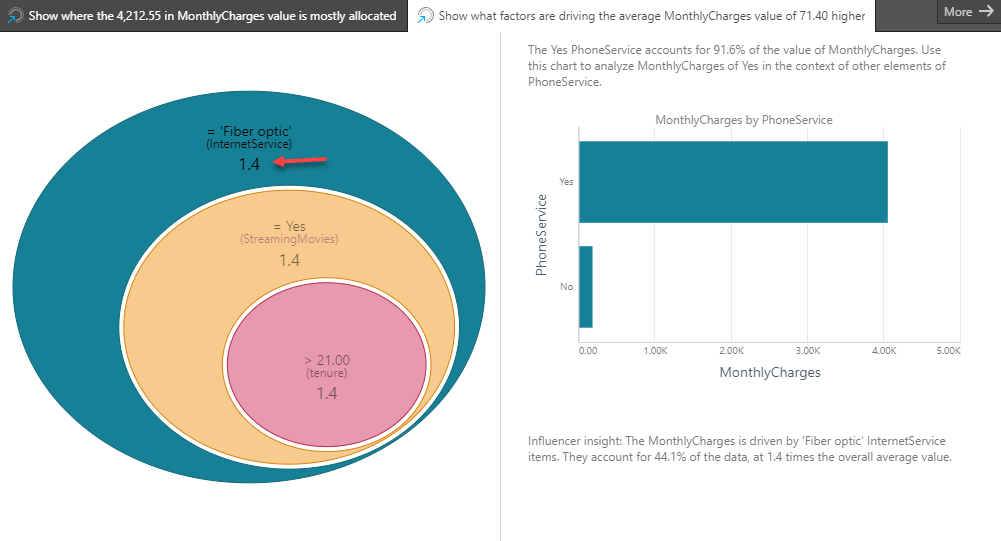
In the Explain interface, the outer oval of the Influencers visualization represents the segment of the customer base where Internet Service=Fiber optic. The details in the oval also show that this segment has an impact factor of 1.4. This metric shows how much higher the average Monthly Cost is in this segment is over the average for the whole customer base (95.18/70.21). The remaining ovals in the visualization are determined by the algorithm in the same way as was described earlier. One critical difference here is that the Influencers analysis also considers numeric metric values. We can see that in the innermost oval of the visualization, where the tenure metric has been selected by the algorithm. In this case, the innermost oval defines a segment of the customer base where Internet Service=Fiber optic, Streaming Movies=Yes and tenure is over 21.0.
Again, the tree visualization provides additional information by presenting the top n (user-configurable) categorical elements per node of the tree.